| Next Page | Up One Level |
Lecture Slides available: PDF PowerPoint
Database Analysis
Contents
- Introduction
- Database Analysis Life Cycle
- Three-level Database Model
- Basics
- Degree of a Relationship
- Degree of a Relationship
- Replacing ternary relationships
- Cardinality
- Optionality
- Entity Sets
- Confirming Correctness
- Deriving the relationship parameters
- Redundant relationships
- Redundant relationships example
- Splitting n:m Relationships
- Splitting n:m Relationships - Example
- Constructing an ER model
This unit it concerned with the process of taking a database specification from a customer and implementing the underlying database structure necessary to support that specification.
Introduction
Data analysis is concerned with the NATURE and USE of data. It involves the identification of the data elements which are needed to support the data processing system of the organization, the placing of these elements into logical groups and the definition of the relationships between the resulting groups.
Other approaches, e.g. D.F.Ds and Flowcharts, have been concerned with the flow of data-dataflow methodologies. Data analysis is one of several data structure based methodologies Jackson SP/D is another.
Systems analysts often, in practice, go directly from fact finding to implementation dependent data analysis. Their assumptions about the usage of properties of and relationships between data elements are embodied directly in record and file designs and computer procedure specifications. The introduction of Database Management Systems (DBMS) has encouraged a higher level of analysis, where the data elements are defined by a logical model or `schema' (conceptual schema). When discussing the schema in the context of a DBMS, the effects of alternative designs on the efficiency or ease of implementation is considered, i.e. the analysis is still somewhat implementation dependent. If we consider the data relationships, usages and properties that are important to the business without regard to their representation in a particular computerised system using particular software, we have what we are concerned with, implementationindependent data analysis.
It is fair to ask why data analysis should be done if it is possible, in practice to go straight to a computerised system design. Data analysis is time consuming; it throws up a lot of questions. Implementation may be slowed down while the answers are sought. It is more expedient to have an experienced analyst `get on with the job' and come up with a design straight away. The main difference is that data analysis is more likely to result in a design which meets both present and future requirements, being more easily adapted to changes in the business or in the computing equipment. It can also be argued that it tends to ensure that policy questions concerning the organisations' data are answered by the managers of the organisation, not by the systems analysts. Data analysis may be thought of as the `slow and careful' approach, whereas omitting this step is `quick and dirty'.
From another viewpoint, data analysis provides useful insights for general design principals which will benefit the trainee analyst even if he finally settles for a `quick and dirty' solution.
The development of techniques of data analysis have helped to understand the structure and meaning of data in organisations. Data analysis techniques can be used as the first step of extrapolating the complexities of the real world into a model that can be held on a computer and be accessed by many users. The data can be gathered by conventional methods such as interviewing people in the organisation and studying documents. The facts can be represented as objects of interest. There are a number of documentation tools available for data analysis, such as entityrelationship diagrams. These are useful aids to communication, help to ensure that the work is carried out in a thorough manner, and ease the mapping processes that follow data analysis. Some of the documents can be used as source documents for the data dictionary.
In data analysis we analyse the data and build a systems representation in the form of a data model (conceptual). A conceptual data model specifies the structure of the data and the processes which use that data.
Data Analysis = establishing the nature of data.
Functional Analysis = establishing the use of data.
However, since Data and Functional Analysis are so intermixed, we shall use the term Data Analysis to cover both.
Building a model of an organisation is not easy. The whole organisation is too large as there will be too many things to be modelled. It takes too long and does not achieve anything concrete like an information system, and managers want tangible results fairly quickly. It is therefore the task of the data analyst to model a particular view of the organisation, one which proves reasonable and accurate for most applications and uses. Data has an intrinsic structure of its own, independent of processing, reports formats etc. The data model seeks to make explicit that structure
Data analysis was described as establishing the nature and use of data.
Database Analysis Life Cycle
-
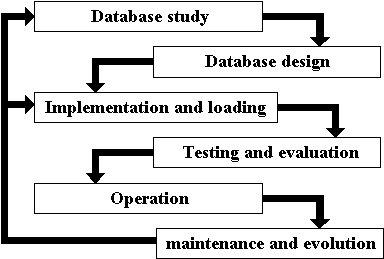
- Figure : Database Analysis Life Cycle
When a database designer is approaching the problem of constructing a database system, the logical steps followed is that of the database analysis life cycle:
- Database study - here the designer creates a written specification in words for the database system to be built. This involves:
- analysing the company situation - is it an expanding company, dynamic in its requirements, mature in nature, solid background in employee training for new internal products, etc. These have an impact on how the specification is to be viewed.
- define problems and constraints - what is the situation currently? How does the company deal with the task which the new database is to perform. Any issues around the current method? What are the limits of the new system?
- define objectives - what is the new database system going to have to do, and in what way must it be done. What information does the company want to store specifically, and what does it want to calculate. How will the data evolve.
- define scope and boundaries - what is stored on this new database system, and what it stored elsewhere. Will it interface to another database?
- Database Design - conceptual, logical, and physical design steps in taking specifications to physical implementable designs. This is looked at more closely in a moment.
- Implementation and loading - it is quite possible that the database is to run on a machine which as yet does not have a database management system running on it at the moment. If this is the case one must be installed on that machine. Once a DBMS has been installed, the database itself must be created within the DBMS. Finally, not all databases start completely empty, and thus must be loaded with the initial data set (such as the current inventory, current staff names, current customer details, etc).
- Testing and evaluation - the database, once implemented, must be tested against the specification supplied by the client. It is also useful to test the database with the client using mock data, as clients do not always have a full understanding of what they thing they have specified and how it differs from what they have actually asked for! In addition, this step in the life cycle offers the chance to the designer to fine-tune the system for best performance. Finally, it is a good idea to evaluate the database in-situ, along with any linked applications.
- Operation - this step is where the system is actually in real usage by the company.
- Maintenance and evolution - designers rarely get everything perfect first time, and it may be the case that the company requests changes to fix problems with the system or to recommend enhancements or new requirements.
- Commonly development takes place without change to the database structure. In elderly systems the DB structure becomes fossilised.
Three-level Database Model
Often referred to as the three-level model, this is where the design moves from a written specification taken from the real-world requirements to a physically-implementable design for a specific DBMS. The three levels commonly referred to are `Conceptual Design', `Data Model Mapping', and `Physical Design'.
-
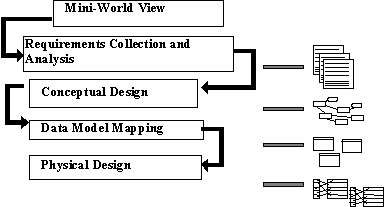
- Figure : Logic behind the three level architecture
The specification is usually in the form of a written document containing customer requirements, mock reports, screen drawings and the like, written by the client to indicate the requirements which the final system is to have. Often such data has to be collected together from a variety of internal sources to the company and then analysed to see if the requirements are necessary, correct, and efficient.
Once the Database requirements have been collated, the Conceptual Design phase takes the requirements and produces a high-level data model of the database structure. In this module, we use ER modelling to represent high-level data models, but there are other techniques. This model is independent of the final DBMS which the database will be installed in.
Next, the Conceptual Design phase takes the high-level data model it taken and converted into a conceptual schema, which is specific to a particular DBMS class (e.g. relational). For a relational system, such as Oracle, an appropriate conceptual schema would be relations.
Finally, in the Physical Design phase the conceptual schema is converted into database internal structures. This is specific to a particular DBMS product.
Basics
Entity Relationship (ER) modelling
- is a design tool
- is a graphical representation of the database system
- provides a high-level conceptual data model
- supports the user's perception of the data
- is DBMS and hardware independent
- had many variants
- is composed of entities, attributes, and relationships
Entities
- An entity is any object in the system that we want to model and store information about
- Individual objects are called entities
- Groups of the same type of objects are called entity types or entity sets
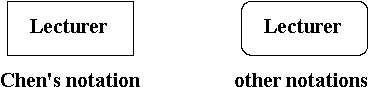
- Entities are represented by rectangles (either with round or square corners)
-
- Figure: Entities
- There are two types of entities; weak and strong entity types.
Attribute
- All the data relating to an entity is held in its attributes.
- An attribute is a property of an entity.
- Each attribute can have any value from its domain.
- Each entity within an entity type:
- May have any number of attributes.
- Can have different attribute values than that in any other entity.
- Have the same number of attributes.
- Attributes can be
- simple or composite
- single-valued or multi-valued
- Attributes can be shown on ER models
- They appear inside ovals and are attached to their entity.
- Note that entity types can have a large number of attributes... If all are shown then the diagrams would be confusing. Only show an attribute if it adds information to the ER diagram, or clarifies a point.
-
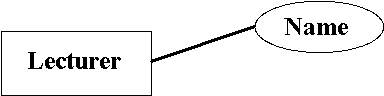
- Figure : Attributes
Keys
- A key is a data item that allows us to uniquely identify individual occurrences or an entity type.
- A candidate key is an attribute or set of attributes that uniquely identifies individual occurrences or an entity type.
- An entity type may have one or more possible candidate keys, the one which is selected is known as the primary key.
- A composite key is a candidate key that consists of two or more attributes
- The name of each primary key attribute is underlined.
Relationships
- A relationship type is a meaningful association between entity types
- A relationship is an association of entities where the association includes one entity from each participating entity type.
- Relationship types are represented on the ER diagram by a series of lines.
- As always, there are many notations in use today...
- In the original Chen notation, the relationship is placed inside a diamond, e.g. managers manage employees:
-

- Figure : Chens notation for relationships
- For this module, we will use an alternative notation, where the relationship is a label on the line. The meaning is identical
-

- Figure : Relationships used in this document
Degree of a Relationship
- The number of participating entities in a relationship is known as the degree of the relationship.
- If there are two entity types involved it is a binary relationship type
-

- Figure : Binary Relationships
- If there are three entity types involved it is a ternary relationship type
-

- Figure : Ternary relationship
- It is possible to have a n-ary relationship (e.g. quaternary or unary).
- Unary relationships are also known as a recursive relationship.
-
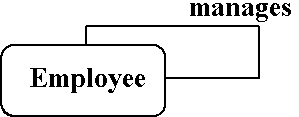
- Figure : Recursive relationship
- It is a relationship where the same entity participates more than once in different roles.
- In the example above we are saying that employees are managed by employees.
- If we wanted more information about who manages whom, we could introduce a second entity type called manager.
Degree of a Relationship
- It is also possible to have entities associated through two or more distinct relationships.
-
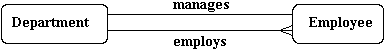
- Figure : Multiple relationships
- In the representation we use it is not possible to have attributes as part of a relationship. To support this other entity types need to be developed.
Replacing ternary relationships
When ternary relationships occurs in an ER model they should always be removed before finishing the model. Sometimes the relationships can be replaced by a series of binary relationships that link pairs of the original ternary relationship.
-
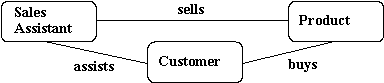
- Figure : A ternary relationship example
- This can result in the loss of some information - It is no longer clear which sales assistant sold a customer a particular product.
- Try replacing the ternary relationship with an entity type and a set of binary relationships.
Relationships are usually verbs, so name the new entity type by the relationship verb rewritten as a noun.
- The relationship sells can become the entity type sale.
-
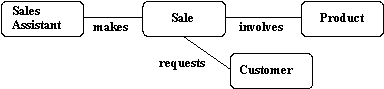
- Figure : Replacing a ternary relationship
- So a sales assistant can be linked to a specific customer and both of them to the sale of a particular product.
- This process also works for higher order relationships.
Cardinality
- Relationships are rarely one-to-one
- For example, a manager usually manages more than one employee
- This is described by the cardinality of the relationship, for which there are four possible categories.
- One to one (1:1) relationship
- One to many (1:m) relationship
- Many to one (m:1) relationship
- Many to many (m:n) relationship
- On an ER diagram, if the end of a relationship is straight, it represents 1, while a "crow's foot" end represents many.
- A one to one relationship - a man can only marry one woman, and a woman can only marry one man, so it is a one to one (1:1) relationship
-

- Figure : One to One relationship example
- A one to may relationship - one manager manages many employees, but each employee only has one manager, so it is a one to many (1:n) relationship
-

- Figure : One to Many relationship example
- A many to one relationship - many students study one course. They do not study more than one course, so it is a many to one (m:1) relationship
-

- Figure : Many to One relationship example
- A many to many relationship - One lecturer teaches many students and a student is taught by many lecturers, so it is a many to many (m:n) relationship
-

- Figure : Many to Many relationship example
Optionality
A relationship can be optional or mandatory.
- If the relationship is mandatory
- an entity at one end of the relationship must be related to an entity at the other end.
- The optionality can be different at each end of the relationship
- For example, a student must be on a course. This is mandatory. To the relationship `student studies course' is mandatory.
- But a course can exist before any students have enrolled. Thus the relationship `course is_studied_by student' is optional.
- To show optionality, put a circle or `0' at the `optional end' of the relationship.
- As the optional relationship is `course is_studied_by student', and the optional part of this is the student, then the `O' goes at the student end of the relationship connection.
-

- Figure : Optionality example
- It is important to know the optionality because you must ensure that whenever you create a new entity it has the required mandatory links.
Entity Sets
Sometimes it is useful to try out various examples of entities from an ER model. One reason for this is to confirm the correct cardinality and optionality of a relationship. We use an `entity set diagram' to show entity examples graphically. Consider the example of `course is_studied_by student'.
-
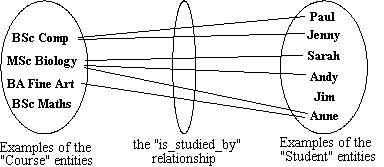
- Figure : Entity set example
Confirming Correctness
-
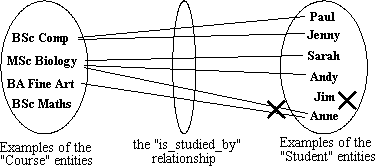
- Figure : Entity set confirming errors
- Use the diagram to show all possible relationship scenarios.
- Go back to the requirements specification and check to see if they are allowed.
- If not, then put a cross through the forbidden relationships
- This allows you to show the cardinality and optionality of the relationship
Deriving the relationship parameters
To check we have the correct parameters (sometimes also known as the degree) of a relationship, ask two questions:
- One course is studied by how many students? Answer = `zero or more'.
- This gives us the degree at the `student' end.
- The answer `zero or more' needs to be split into two parts.
- The `more' part means that the cardinality is `many'.
- The `zero' part means that the relationship is `optional'.
- If the answer was `one or more', then the relationship would be `mandatory'.
- One student studies how many courses? Answer = `One'
- This gives us the degree at the `course' end of the relationship.
- The answer `one' means that the cardinality of this relationship is 1, and is `mandatory'
- If the answer had been `zero or one', then the cardinality of the relationship would have been 1, and be `optional'.
Redundant relationships
Some ER diagrams end up with a relationship loop.
- check to see if it is possible to break the loop without losing info
- Given three entities A, B, C, where there are relations A-B, B-C, and C-A, check if it is possible to navigate between A and C via B. If it is possible, then A-C was a redundant relationship.
- Always check carefully for ways to simplify your ER diagram. It makes it easier to read the remaining information.
Redundant relationships example
- Consider entities `customer' (customer details), `address' (the address of a customer) and `distance' (distance from the company to the customer address).
-
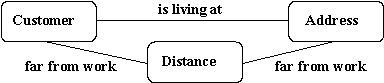
- Figure : Redundant relationship
Splitting n:m Relationships
A many to many relationship in an ER model is not necessarily incorrect. They can be replaced using an intermediate entity. This should only be done where:
- the m:n relationship hides an entity
- the resulting ER diagram is easier to understand.
Splitting n:m Relationships - Example
Consider the case of a car hire company. Customers hire cars, one customer hires many card and a car is hired by many customers.
-

- Figure : Many to Many example
The many to many relationship can be broken down to reveal a `hire' entity, which contains an attribute `date of hire'.
-

- Figure : Splitting the Many to Many example
Constructing an ER model
Before beginning to draw the ER model, read the requirements specification carefully. Document any assumptions you need to make.
- Identify entities - list all potential entity types. These are the object of interest in the system. It is better to put too many entities in at this stage and them discard them later if necessary.
- Remove duplicate entities - Ensure that they really separate entity types or just two names for the same thing.
- Also do not include the system as an entity type
- e.g. if modelling a library, the entity types might be books, borrowers, etc.
- The library is the system, thus should not be an entity type.
- List the attributes of each entity (all properties to describe the entity which are relevant to the application).
- Ensure that the entity types are really needed.
- are any of them just attributes of another entity type?
- if so keep them as attributes and cross them off the entity list.
- Do not have attributes of one entity as attributes of another entity!
- Mark the primary keys.
- Which attributes uniquely identify instances of that entity type?
- This may not be possible for some weak entities.
- Define the relationships
- Examine each entity type to see its relationship to the others.
- Describe the cardinality and optionality of the relationships
- Examine the constraints between participating entities.
- Remove redundant relationships
- Examine the ER model for redundant relationships.
ER modelling is an iterative process, so draw several versions, refining each one until you are happy with it. Note that there is no one right answer to the problem, but some solutions are better than others!
| Next Page | Up One Level |
| ||||
| ||||
|